How Nonprofits Can Tell Powerful Stories Using Data Visualization
Are you struggling to see results from your storytelling? Then it might be time to “see” your storytelling in a new light, using data visualization.
In general, humans are better able to recall information from images than they are text. Three days after reading text, we can recall about ten percent of it. When it’s paired with an image? It jumps to 65% recall.
Nonprofits can use this to their advantage and stand out in the crowded landscape of constant messages donors receive, by designing to support their storytelling, especially digitally. Whether it’s your homepage, a landing page, a special report, or an app, showcasing your data visually will make it more memorable for your audience.
Steps to Using Data Visualization Successfully
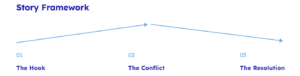
1. Identify the Story
What is the story your data is telling? Every story is unique, and yet, every story has certain elements in common. A hook to draw the reader’s attention, a conflict that has to be addressed, and a resolution to that conflict.
For example, imagine your nonprofit provides services to individuals and families struggling with houselessness. Your data demonstrates that over the last year, the median age of the people receiving your services has gone up considerably. As you look at the data, you discover that several different factors have combined to create an older population seeking services than ever before.
There’s a story in there: More older people are struggling with housing. Why? What can be done?
2. Design to Support the Story
 How can you show the story through visualized data? Consider:
-
- Graphs
- Charts
- Visual comparisons
- Interactive data
- Maps
- Diagrams
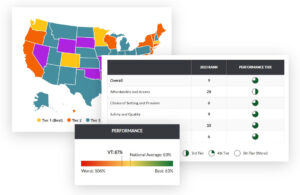
For our seniors struggling with housing example, you might include a chart comparing the median age of your population at various intervals, showing how the age has gone up over time. You could create a scorecard for how senior-friendly a community is, showing senior housing resources, or the lack thereof, average rent prices, and average income of different age groups.
As you design your visualizations, remember to keep things simple. Too much visual information is just as overwhelming as a block of text. Use colors and iconography to aid understanding, and focus on the top-line big picture before digging into details.
3. Know the Data
Data is ever-changing. As you create data visualizations, you need a clear understanding of the data you need, including:
-
- What is your data architecture? What are the relationships that will need to exist?
- What are the data sources? Are they trustworthy and dependable?
- Will you need to update your data? When? How will source extraction happen? How frequently?
- Does that data come from different sources and need to be normalized?
- How will loading into the app/website happen?
4. Iterate and Improve
Creating data visualizations shouldn’t happen in a vacuum. Invite feedback throughout the process, and continue to iterate and experiment after you’ve launched.
Data visualization allows nonprofits to transform raw numbers into compelling stories that resonate with their audience. By identifying the core narrative, designing visuals that enhance the message, and understanding the nuances of your data, your organization can make a memorable impact. When done thoughtfully, data visualization turns complex information into an accessible, powerful tool for inspiring action and engagement.

Guest blog by: TJ Peeler, Director of User Experience, Allegiance Group. Peeler has been creating digital experiences that get the right content to the right user at the right time for over 15 years and has worked with clients such as the League of Women Voters, American Physical Therapy Association, Mass Audubon, and American Forests.